This web page was produced as an assignment for Genetics 564, an undergraduate course at UW-Madison.
Future research to investigate HPRT1 and Lesch-Nyhan Syndrome
The known function of HPRT is to add a phosphate group to guanine and hypoxanthine to create the nucleotides GMP and IMP, respectively, which are used to build DNA and RNA [1]. In Lesch-Nyhan Syndrome (LNS) the function of HPRT is knocked out, and salvaging these nucleotides precursors is impossible. To compensate, organisms increase the de novo synthesis of GMP and IMP. Downstream products build up, one of which is uric acid, which creates gout and kidney stones in humans (Figure 1). Although these symptoms of LNS are accounted for by this basic mechanism, we still do not understand the mechanism by which the knockout of HPRT function leads to the seemingly more complex motor control problems, cognitive defects, and self-mutilative behaviors.
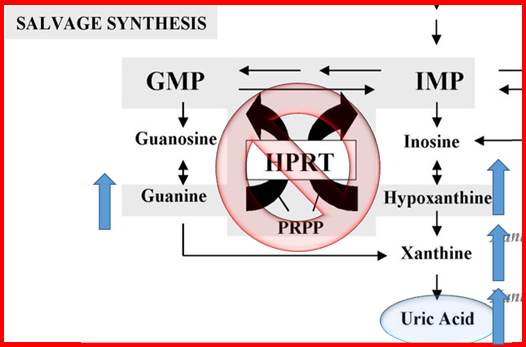
Figure 1: Mechanism through which the knockout of HPRT leads to increased production of uric acid in the tissues, leading to gouty arthritis and kidney stones. Without HPRT to salvage guanine and hypoxanthine, increased de novo synthesis of GMP and IMP occurs and generates greater amounts of downstream products, including uric acid.
One pharmacological rat model showed that the complex neurological phenotypes of LNS, including self-biting and the loss of locomotion, may be caused by abnormal brain development, induced by low brain dopamine levels neonatally [2], but this has been disputed. Overall, very little is known about how the loss of HPRT function leads to neurological dysfunction. My goal then, is to determine the genomic and proteomic changes that contribute the LNS neurological dysfunction as a result of mutations in the HPRT1 gene. Hopefully, these experiments will help to uncover the mechanism by which loss of HPRT function leads to the complex cognitive-behavioral symptoms of LNS.
For my aims, I will use zebrafish as my model organism for a variety of reasons. Zebrafish are quick, cheap, and easy to raise in large numbers, making them ideal for molecular experiments that require brain tissue samples. Also, zebrafish have similar brain structures as humans, and their brains are similarly regulated by dopamine. Zebrafish also grow transparently, making it easy to visualize any abnormal developments of brain structures. Lastly, zebrafish HPRT shares a 91% identity to human HPRT. For all of these reasons, the zebrafish is an effective model organism for my aims.
For my aims, I will use zebrafish as my model organism for a variety of reasons. Zebrafish are quick, cheap, and easy to raise in large numbers, making them ideal for molecular experiments that require brain tissue samples. Also, zebrafish have similar brain structures as humans, and their brains are similarly regulated by dopamine. Zebrafish also grow transparently, making it easy to visualize any abnormal developments of brain structures. Lastly, zebrafish HPRT shares a 91% identity to human HPRT. For all of these reasons, the zebrafish is an effective model organism for my aims.
Aim 1: What proteins interact with HPRT?
The first goal is to determine the proteins to which HPRT binds. To do this, I will use affinity purification-mass spectrometry to identify the direct targets of HPRT in the brain tissue of zebrafish [4]. I also used the STRING database to identify proteins that interact with HPRT and are conserved between zebrafish and humans. I then used Gene Ontology (GO) to sort the identified proteins by their functions [3]. This procedure allows me to discern any potential pathways through which the loss of HPRT function may lead to the neurological-behavioral symptoms of LNS. Figure 2 shows a mechanistically interesting set of proteins that interact with HPRT, identified through STRING.
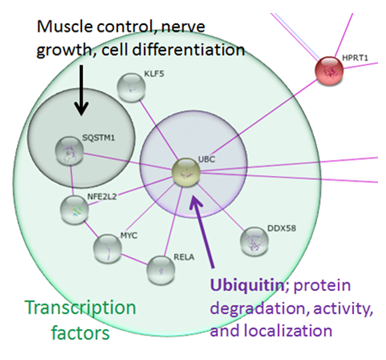
Figure 2: Proteins that interact with HPRT, identified using the STRING database.
HPRT interacts directly with Ubiquitin C (UBC), a protein that controls protein activity, degradation, and localization. In turn, UBC interacts with many transcription factors, such as SQSTM1, that are involved in pathways that control muscle control, nerve growth, and cell differentiation. These processes are related to the phenotypes found in LNS, making these genes possible targets of future research to identify the mechanism that leads to LNS neurological dysfunction.
If HPRT is normally expressed highly in brain tissues, then HPRT may sequester much of the UBC found in the cytoplasm. In LNS, however, the knockout of HPRT function may allow UBC to bind to other proteins, including SQSTM1, and mark them for degradation at higher rates than normal. SQSTM1 activates NF-KB, NGF, and titin/TTN, which control synaptic plasticity and dendrite growth, nerve growth, and normal movement, respectively. Therefore, through this potential mechanism, a knockout of HPRT function may lead to decreased brain growth and plasticity and cause movement disorders. This abnormal brain development may lead to the complex neurological phenotypes associated with LNS.
By determining the protein interaction partners of HPRT, we can identify potential potential pathways through which the loss of HPRT may lead to the neurological dysfunctions found in LNS. This aim will identify targets for future research to determine the mechanism leading from HPRT knockout to complex LNS symptoms.
Aim 2: Are protein expression levels altered in LNS?
Once I identify proteins that interact with HPRT and that could be involved in the pathway leading to LNS phenotypes (Aim 1), next I need to show that the levels of these proteins are actually altered in LNS. To do this, I will use quantitative mass spectrometry to compare the level of protein expression in the brains of wild-type and HPRT-mutant zebrafish (Figure 3).
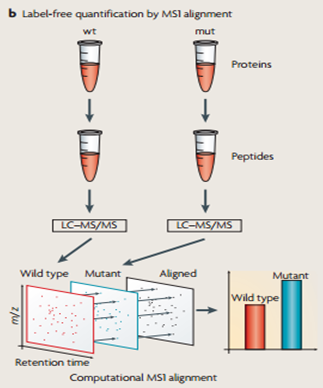
Figure 3: The procedure for quantitative mass spectrometry. This method can be used to compare the protein expression levels in wild-type and HPRT-mutant zebrafish brains.
Proteins that have significantly different levels of expression in HPRT-mutant versus wild-type zebrafish brains may be targets of future research to determine their relationship to LNS phenotypes. For example, based on the potential mechanism identified in Aim 1, I might expect that SQSTM1 expression would be significantly lower in HPRT-mutant zebrafish. Together, Aims 1 and 2 can determine what proteins interact with HPRT and if these protein levels are actually altered in HPRT-mutant individuals. These two Aims will be extremely useful in identifying proteins that may be involved in the mechanism that leads from HPRT knockout to LNS neurological dysfunction.
Aim 3: Is gene expression altered during brain development in LNS?
I will characterize how gene expression levels change during zebrafish brain development as a result of mutations in HRPT. Using a DNA microarray, I will quantify the expression levels of all genes in the brains of wild-type and HPRT-mutant zebrafish at each major stage of brain development, from birth through adulthood (Figure 4). Comparing these gene expression levels on a microarray will allow me to determine which genes are affected by the loss of HPRT function. This assay is also expected to indicate the stage in development in which loss-of-function mutations in HPRT alter neuronal gene function, indicating how and when brain development may be altered by HPRT mutation.
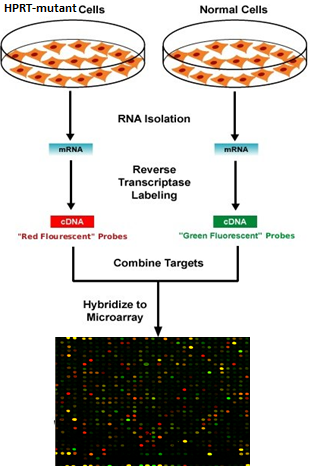
Figure 4: Procedure to use DNA microarray to determine which genes have significantly different expression levels as a result of loss of HPRT function. I will isolate and compare the expression levels of mRNA from the brain tissue of wild-type and HPRT-mutant zebrafish at each major stage of development.
After determining when specific genes are expressed at significantly different levels in HPRT-mutant versus wild-type zebrafish, I will analyze these genes by GO terms. This should reveal biochemical pathways and biological processes affected by the knockout of HPRT, potentially pointing me toward the mechanism by which loss of HPRT function leads to the LNS phenotypes. I hypothesize that pathways implicated in neurogenesis and dopamine metabolism will be identified.
Future Directions
These aims are expected to indicate how gene expression and protein interactions change as a result of HPRT mutations. The overall goal is to gain insights into the mechanisms that lead to the neuronal-behavioral phenotypes of LNS. This work will also likely lead to potential targets for therapeutic intervention of LNS while also advancing our understanding of purine biosynthesis and salvage pathways.
Proteins that (1) interact with HPRT and (2) are shown to have different expression levels in individuals with HPRT functional knockouts may be targets for future research. Knocking out the genes for these proteins and observing if neurological or behavioral LNS phenotypes appear would give insight into the mechanism by which loss of HPRT function leads to the complex symptoms associated with LNS.
Proteins that (1) interact with HPRT and (2) are shown to have different expression levels in individuals with HPRT functional knockouts may be targets for future research. Knocking out the genes for these proteins and observing if neurological or behavioral LNS phenotypes appear would give insight into the mechanism by which loss of HPRT function leads to the complex symptoms associated with LNS.
References:
[1] Torres RJ and Puig JG. (2007). Hypoxanthine-guanine phosophoribosyltransferase (HPRT) deficiency: Lesch-Nyhan syndrome. Orphanet Journal of Rare Diseases, 2, 48. doi:10.1186/1750-1172-2-48
[2] Breese GR, Criswell HE, Duncan GE, Mueller RA. (1990). A dopamine deficiency model of Lesch-Nyhan disease – the neonatal-6-OHDA-lesioned rat. Brain Res Bull, 25, 477-484. DOI: 10.1016/0361-9230(90)90240-Z
[3] Gene Ontology Consortium. An Introduction to the Gene Ontology. Accessed 26 February 2015.
[4] Gingras AC, Gstaiger M, Raught B, and Aebersold R. (2007). Analysis of protein complexes using mass spectrometry. Nat Rev Mol Cell Biol, 19(4), 645-654.
Images:
Figure 1: function and pathway of HPRT
Figure 2: derived from STRING
Figure 3: quantitative mass spec. procedure
Figure 4: microarray procedure
| final_lesch-nyhan_syndrome_and_hprt1_presentation.pdf |
| final_lesch-nyhan_syndrome_and_hprt1_presentation.pptx |
| lesch-nyhan_syndrome_and_hprt1_-_final_presentation_(2).pptx |
| lesch-nyhan_syndrome_and_hprt1_-_final_presentation.pptx |
