This web page was produced as an assignment for Genetics 564, an undergraduate course at UW-Madison.
Gene Homology
What is Homology?
The forelimbs of a dolphin and a bat have the same arrangement of bones, even though one serves as a flipper and the other as a wing. Charles Darwin explained these similarities in different species through the process of common descent. As species diverge from a common ancestor in the process of evolution, they become more and more different from each other. However, these diverged species also retain structural similarities. Homologous traits are those that are shared between two or more species because they are present in, and inherited from, a common ancestor [1]. But what does this look like on a molecular level?
Genes evolve in the same was as physical structures. New genes don't spontaneously emerge. Instead, existing genes accumulate mutations. These mutations change protein structures and expression levels, eventually leading to species divergence. Because of this, genes in different species are often highly similar and are considered "conserved". For example, genes involved in cell division are conserved in distantly related species, including roundworms and humans. Common ancestry is the reason we are able to conduct research on mice in order to discover diseases and treatments in humans [2].
Genes that have similar sequences and are descended from a common ancestor are called homologs. We can use an online tool called BLAST to identify homologous genes in different species. BLAST stands for Basic Local Alignment Search Tool. The BLAST website can be found here: http://blast.ncbi.nlm.nih.gov/Blast.cgi
BLAST takes a sequence of DNA, mRNA, or protein and compares it to other known sequences in the database to find ones that are similar. The search results show similar sequences along with indicators of how well those sequences match to the original sequence. One indicator is called '% identity', which measures the percentage of nucleotides (in genes) or amino acids (in proteins) that match between the two sequences [3].
For this project a BLAST search was performed using the mRNA sequence for the HPRT1 gene from humans. The homologs of the human gene are listed below.
HPRT1 Genomic Sequences
Homo sapiens (Human)
Hypoxanthine phosphoribosyltransferase 1 (HPRT1)
Accession: NM_000194.2
Length: 1,435 base pairs
Hypoxanthine phosphoribosyltransferase 1 (HPRT1)
Accession: NM_000194.2
Length: 1,435 base pairs
|
Pan troglodytes (Chimpanzee)
Hypoxanthine phosphoribosyltransferase 1 (HPRT1) Accession: NM_001110817.1 Length: 1,418 base pairs Identity: 99% Canis lupus familiaris (Dog)
Hypoxanthine phosphoribosyltransferase 1 (HPRT1) Accession: NM_001003357.1 Length: 765 base pairs Identity: 94% Oryctolagus cuniculus (Rabbit)
Hypoxanthine phosphoribosyltransferase 1 (Hprt1) Accession: NM_001105671.1 Length: 1,449 base pairs Identity: 89% Ornithorhynchus anatinus (Platypus)
Hypoxanthine phosphoribosyltransferase 1 (HPRT1) Accession: NM_001242751.1 Length: 1,453 base pairs Identity: 86% Rattus norvegicus (Rat)
Hypoxanthine phosphoribosyltransferase 1 (Hprt1) Accession: NM_012583.2 Length: 1,260 base pairs Identity: 81% Xenopus tropicalis (Western Clawed Frog)
Hypoxanthine phosphoribosyltransferase 1 (hprt1) Accession: NM_203981.1 Length: 1,584 base pairs Identity: 80% Caenorhabditis elegans (Roundworm)
Y105E8B.5 Accession: NM_061144.5 Length: 645 base pairs Identity: not found |
Macaca fascicularis (Macaque)
Hypoxanthine-guanine phosphoribosyltransferase (HPRT1) Accession: NM_001283594.1 Length: 1,409 base pairs Identity: 98% Sus scrofa (Pig)
Hypoxanthine phosphoribosyltransferase 1 (HPRT1) Accession: NM_001032376.2 Length: 1,428 base pairs Identity: 90% Bos taurus (Cow)
Hypoxanthine phosphoribosyltransferase 1 (HPRT1) Accession: NM_001034035.2 Length: 1,369 base pairs Identity: 87% Mus musculus (Mouse)
Hypoxanthine guanine phosphoribosyl transferase (Hprt) Accession: NM_013556.2 Length: 1,349 base pairs Identity: 84% Gallus gallus (Chicken)
Hypoxanthine phosphoribosyltransferase 1 (HPRT1) Accession: NM_204848.1 Length: 1,545 base pairs Identity: 80% Danio rerio (Zebrafish)
Hypoxanthine phosphoribosyltransferase 1 (HPRT1) Accession: NM_212986.1 Length: 1,724 base pairs Identity: 77% Arabidopsis thaliana (Thale Cress)
Hypoxanthine phosphoribosyltransferase Accession: NM_105833.4 Length: 761 base pairs Identity: not found |
Analysis:
HPRT1 has homologs in many species. The sequence identities between humans and other organisms are incredibly high (77% identity or higher for each species), indicating that this gene is conserved and has mutated very little across the millions of years since divergence of these various species. The high sequence identities between humans and distantly related species shows the critical importance of HPRT1 for species survival.
HPRT1 has homologs in many species. The sequence identities between humans and other organisms are incredibly high (77% identity or higher for each species), indicating that this gene is conserved and has mutated very little across the millions of years since divergence of these various species. The high sequence identities between humans and distantly related species shows the critical importance of HPRT1 for species survival.
Gene Ontology
What is Gene Ontology?
Gene Ontology (GO) is an initiative by the bioinformatics community to create standardized terms used across all databases to describe gene products. The GO project has developed three controlled categories to detail a gene product's molecular functions, biological processes, and cellular components. Molecular functions describe things like enzymatic activity or protein binding. Biological processes include cell division or brain development. Cellular components depict where the gene product is localized within the cell. While the use of common language is important in itself, the utility of GO continues to expand as researchers identify gene products involved in similar processes, that have similar functions, or are found in the same locations in the cell as their gene of interest [4]. The GO terms for HPRT1 are shown below.
Gene Ontology (GO) is an initiative by the bioinformatics community to create standardized terms used across all databases to describe gene products. The GO project has developed three controlled categories to detail a gene product's molecular functions, biological processes, and cellular components. Molecular functions describe things like enzymatic activity or protein binding. Biological processes include cell division or brain development. Cellular components depict where the gene product is localized within the cell. While the use of common language is important in itself, the utility of GO continues to expand as researchers identify gene products involved in similar processes, that have similar functions, or are found in the same locations in the cell as their gene of interest [4]. The GO terms for HPRT1 are shown below.
|
HPRT1 Biological Processes
Purine salvage pathway Dendrite morphogenesis Dopamine metabolism Locomotory behavior Neuron development, differentiation |
HPRT1 Molecular Functions
Magnesium ion binding Phosphoribosyltransferase activity Nucleotide binding |
HPRT1 Cellular Components
Cytoplasm Cytosol Extracellular vesicular exosome |
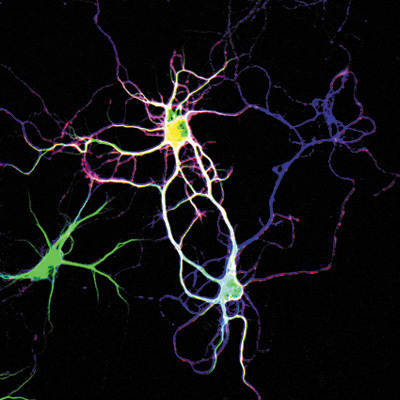
Figure 1: Neurons developing connections through the extension of dendrites. Dendrite growth and development in an integral part of brain development and is a GO biological process impacted by HPRT1 protein.
Analysis:
The Gene Ontology terms verify that HPRT1 is involved in transferring phosphoribosyl groups onto purine bases in order to salvage these energetically-costly bases for reuse in the cell. Apparently this molecular function occurs mostly in the cytoplasm of cells. In addition to verifying the known functions of HPRT1, these GO terms also indicate that HPRT1 is involved in processes such as neuron development and differentiation, locomotion of organisms, and dopamine metabolism. These terms may help explain the currently misunderstood mechanisms behind the neurological and behavioral phenotypes of LNS. GO indicates that HPRT1 impacts neuron development and dendrite growth. The behavioral symptoms of LNS may be caused by neurons that do not grow, differentiate, and make connections properly. Dopamine metabolism is also affected by HPRT1, suggesting that altered dopamine levels in the brain may have some influence on the symptoms of LNS. These GO terms provide insight into the potential mechanisms that lead the mutations in HPRT1 to cause the symptoms found in LNS. Research into each of the biological processes identified by GO may yield a greater understanding of how HPRT1 dysfunction leads to LNS symptoms.
The Gene Ontology terms verify that HPRT1 is involved in transferring phosphoribosyl groups onto purine bases in order to salvage these energetically-costly bases for reuse in the cell. Apparently this molecular function occurs mostly in the cytoplasm of cells. In addition to verifying the known functions of HPRT1, these GO terms also indicate that HPRT1 is involved in processes such as neuron development and differentiation, locomotion of organisms, and dopamine metabolism. These terms may help explain the currently misunderstood mechanisms behind the neurological and behavioral phenotypes of LNS. GO indicates that HPRT1 impacts neuron development and dendrite growth. The behavioral symptoms of LNS may be caused by neurons that do not grow, differentiate, and make connections properly. Dopamine metabolism is also affected by HPRT1, suggesting that altered dopamine levels in the brain may have some influence on the symptoms of LNS. These GO terms provide insight into the potential mechanisms that lead the mutations in HPRT1 to cause the symptoms found in LNS. Research into each of the biological processes identified by GO may yield a greater understanding of how HPRT1 dysfunction leads to LNS symptoms.
Gene Expression
|
Every cell in our body has the same DNA, so how is it possible to generate the highly diverse and specialized cell types from the same information template? Neurons, skin, muscles, and blood cells are all derived from the same DNA. How is this possible? The answer lies in differential expression patterns of various genes in different cells. The parts of DNA that are transcribed into RNA determine the outcome of any particular cell. Many factors including drugs, stress, food, diseases, mutations, and tissue type (to name just a few) all create differences in gene expression patterns across cells. All of the RNA transcripts in a certain cell make up its transcriptome. By studying changes in the types and levels of gene expression, we can understand what genes are important for the differences we see between cells and tissues. Figure 2 represents an example of how gene expression patterns can be used to study disease [5].
Gene expression patterns can be uncovered using a microarray. This technique can be used to determine the expression levels of an entire transcriptome, looking at hundreds of thousands of genes in a particular cell or tissue with or without a disease condition. A tutorial showing how to use a DNA microarray to investigate cancer cell expression patterns can be found here [6]. The Gene Expression Omnibus (GEO) database shows the results of various microarray experiments. Using GEO, you can search for a specific gene (HPRT1) or disease condition (Lesch-Nyhan Syndrome) and view the results of any related gene expression microarray experiments done on humans or other model organisms.
|
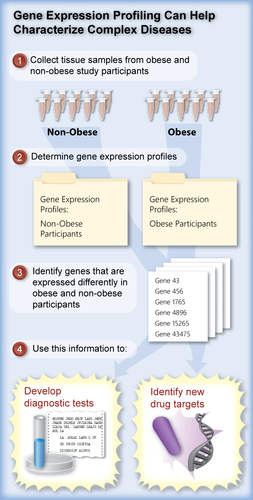
Figure 2: Gene expression can be compared between normal and diseased patients to identify genes with significantly higher or lower levels of expression. Some of these genes may have an influence on the disease and may become drug targets.
|
Gene Expression Profiles of HPRT1
Searching for "HPRT1" in the GEO database yielded 4,034 microarray experiments, which measured changes in HPRT1 expression levels in various tissues after treatment with drugs or under disease conditions. Many studies were irrelevant to LNS or did not show significant changes in HPRT1 in response to stimuli. However, one interesting experiment found that HPRT1 expressed is generally decreased in in the substantia nigra (a brain tissue) in patients with Parkinson's disease. The results of that experiment are shown in Figure 3.
Searching for "HPRT1" in the GEO database yielded 4,034 microarray experiments, which measured changes in HPRT1 expression levels in various tissues after treatment with drugs or under disease conditions. Many studies were irrelevant to LNS or did not show significant changes in HPRT1 in response to stimuli. However, one interesting experiment found that HPRT1 expressed is generally decreased in in the substantia nigra (a brain tissue) in patients with Parkinson's disease. The results of that experiment are shown in Figure 3.
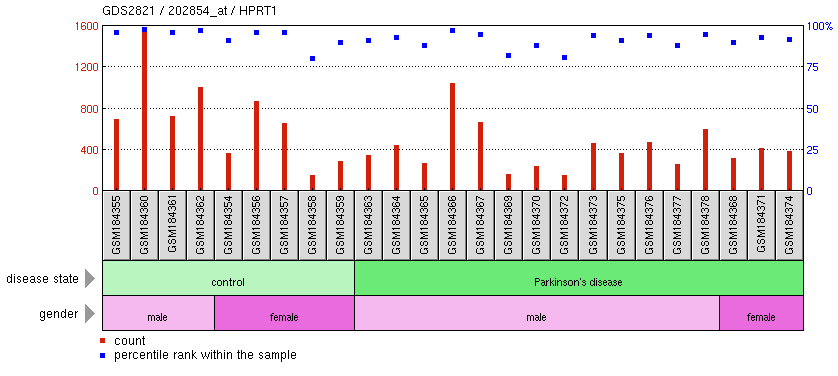
Figure 3: HPRT1 expression levels in the substantia nigra in normal people and patients with Parkinson's. The levels of HPRT1 appear to be generally lower in people with Parkinson's. (Note: The expression levels of HPRT1 may not be significantly different between groups; there is high variability of HPRT1 levels within each group. However, the general pattern seems to show higher HPRT1 expression in people without Parkinson's).
Analysis:
While the results shown on this page certainly do not include all of the data about HPRT1 expression that can be found in the GEO database, the results may give important insights into LNS. Patients with Parkinson's experience tremors (shaking) of limbs, often in the hands and fingers [7]. Similarly, patients with LNS experience chorea (jerking movements) and other involuntary muscle contractions, although the types of muscle contractions is not exactly the same in LNS and Parkinson's. The expression levels of HPRT1 shown in Figure 3 are from the substantia nigra, a brain structure that is important for rewards, addiction, and movement. The results indicate that HPRT1 may play an indirect role in regulating movement. HPRT1 function is knocked out in patients with LNS. Therefore, low or absent levels of HPRT1 expression may replicate the conditions of LNS. Understanding the pathways through which HPRT1 expression influences movement is an important area of future research.
While the results shown on this page certainly do not include all of the data about HPRT1 expression that can be found in the GEO database, the results may give important insights into LNS. Patients with Parkinson's experience tremors (shaking) of limbs, often in the hands and fingers [7]. Similarly, patients with LNS experience chorea (jerking movements) and other involuntary muscle contractions, although the types of muscle contractions is not exactly the same in LNS and Parkinson's. The expression levels of HPRT1 shown in Figure 3 are from the substantia nigra, a brain structure that is important for rewards, addiction, and movement. The results indicate that HPRT1 may play an indirect role in regulating movement. HPRT1 function is knocked out in patients with LNS. Therefore, low or absent levels of HPRT1 expression may replicate the conditions of LNS. Understanding the pathways through which HPRT1 expression influences movement is an important area of future research.
Sources Cited
[1] Herron, J.C. and Freeman S. (2014). Evolutionary Analysis: Fifth Edition. Glenview, IL: Pearson Education, Inc.
[2] Delsuc F, Brinkmann H, Philippe H. (2005). Phylogenomics and the reconstruction of the tree of life. Nat Rev Genet 6:361-375.
[3] About BLAST http://www.ncbi.nlm.nih.gov/books/NBK1734/. Accessed 19 February 2015.
[4] Gene Ontology Consortium. An Introduction to the Gene Ontology. Accessed 26 February 2015.
[5] Genetic Science Learning Center. Measuring Gene Expression. University of Utah Health Sciences. Accessed 6 March 2015.
[6] Genetic Science Learning Center. DNA Microarray. University of Utah Health Sciences. Accessed 6 March 2015.
[7] Mayo Foundation for Medical Education and Research. Parkinson's disease. Mayo Clinic. Accessed 6 March 2015.
Media Sources
Figure 1: Neurons from http://www.cdb.riken.jp/jp/04_news/annual_reports/2006/WebHelp/common/lab1_07hlfig2.htm
Figure 2: Gene expression and disease, from http://learn.genetics.utah.edu/content/science/expression/
Figure 3: HPRT1 expression in Parkinson's, from http://www.ncbi.nlm.nih.gov/geo/tools/profileGraph.cgi?ID=GDS2821:202854_at
